Mpowered Analytics

Powerful B-BBEE reporting has arrived

Browse your data at the speed of thought

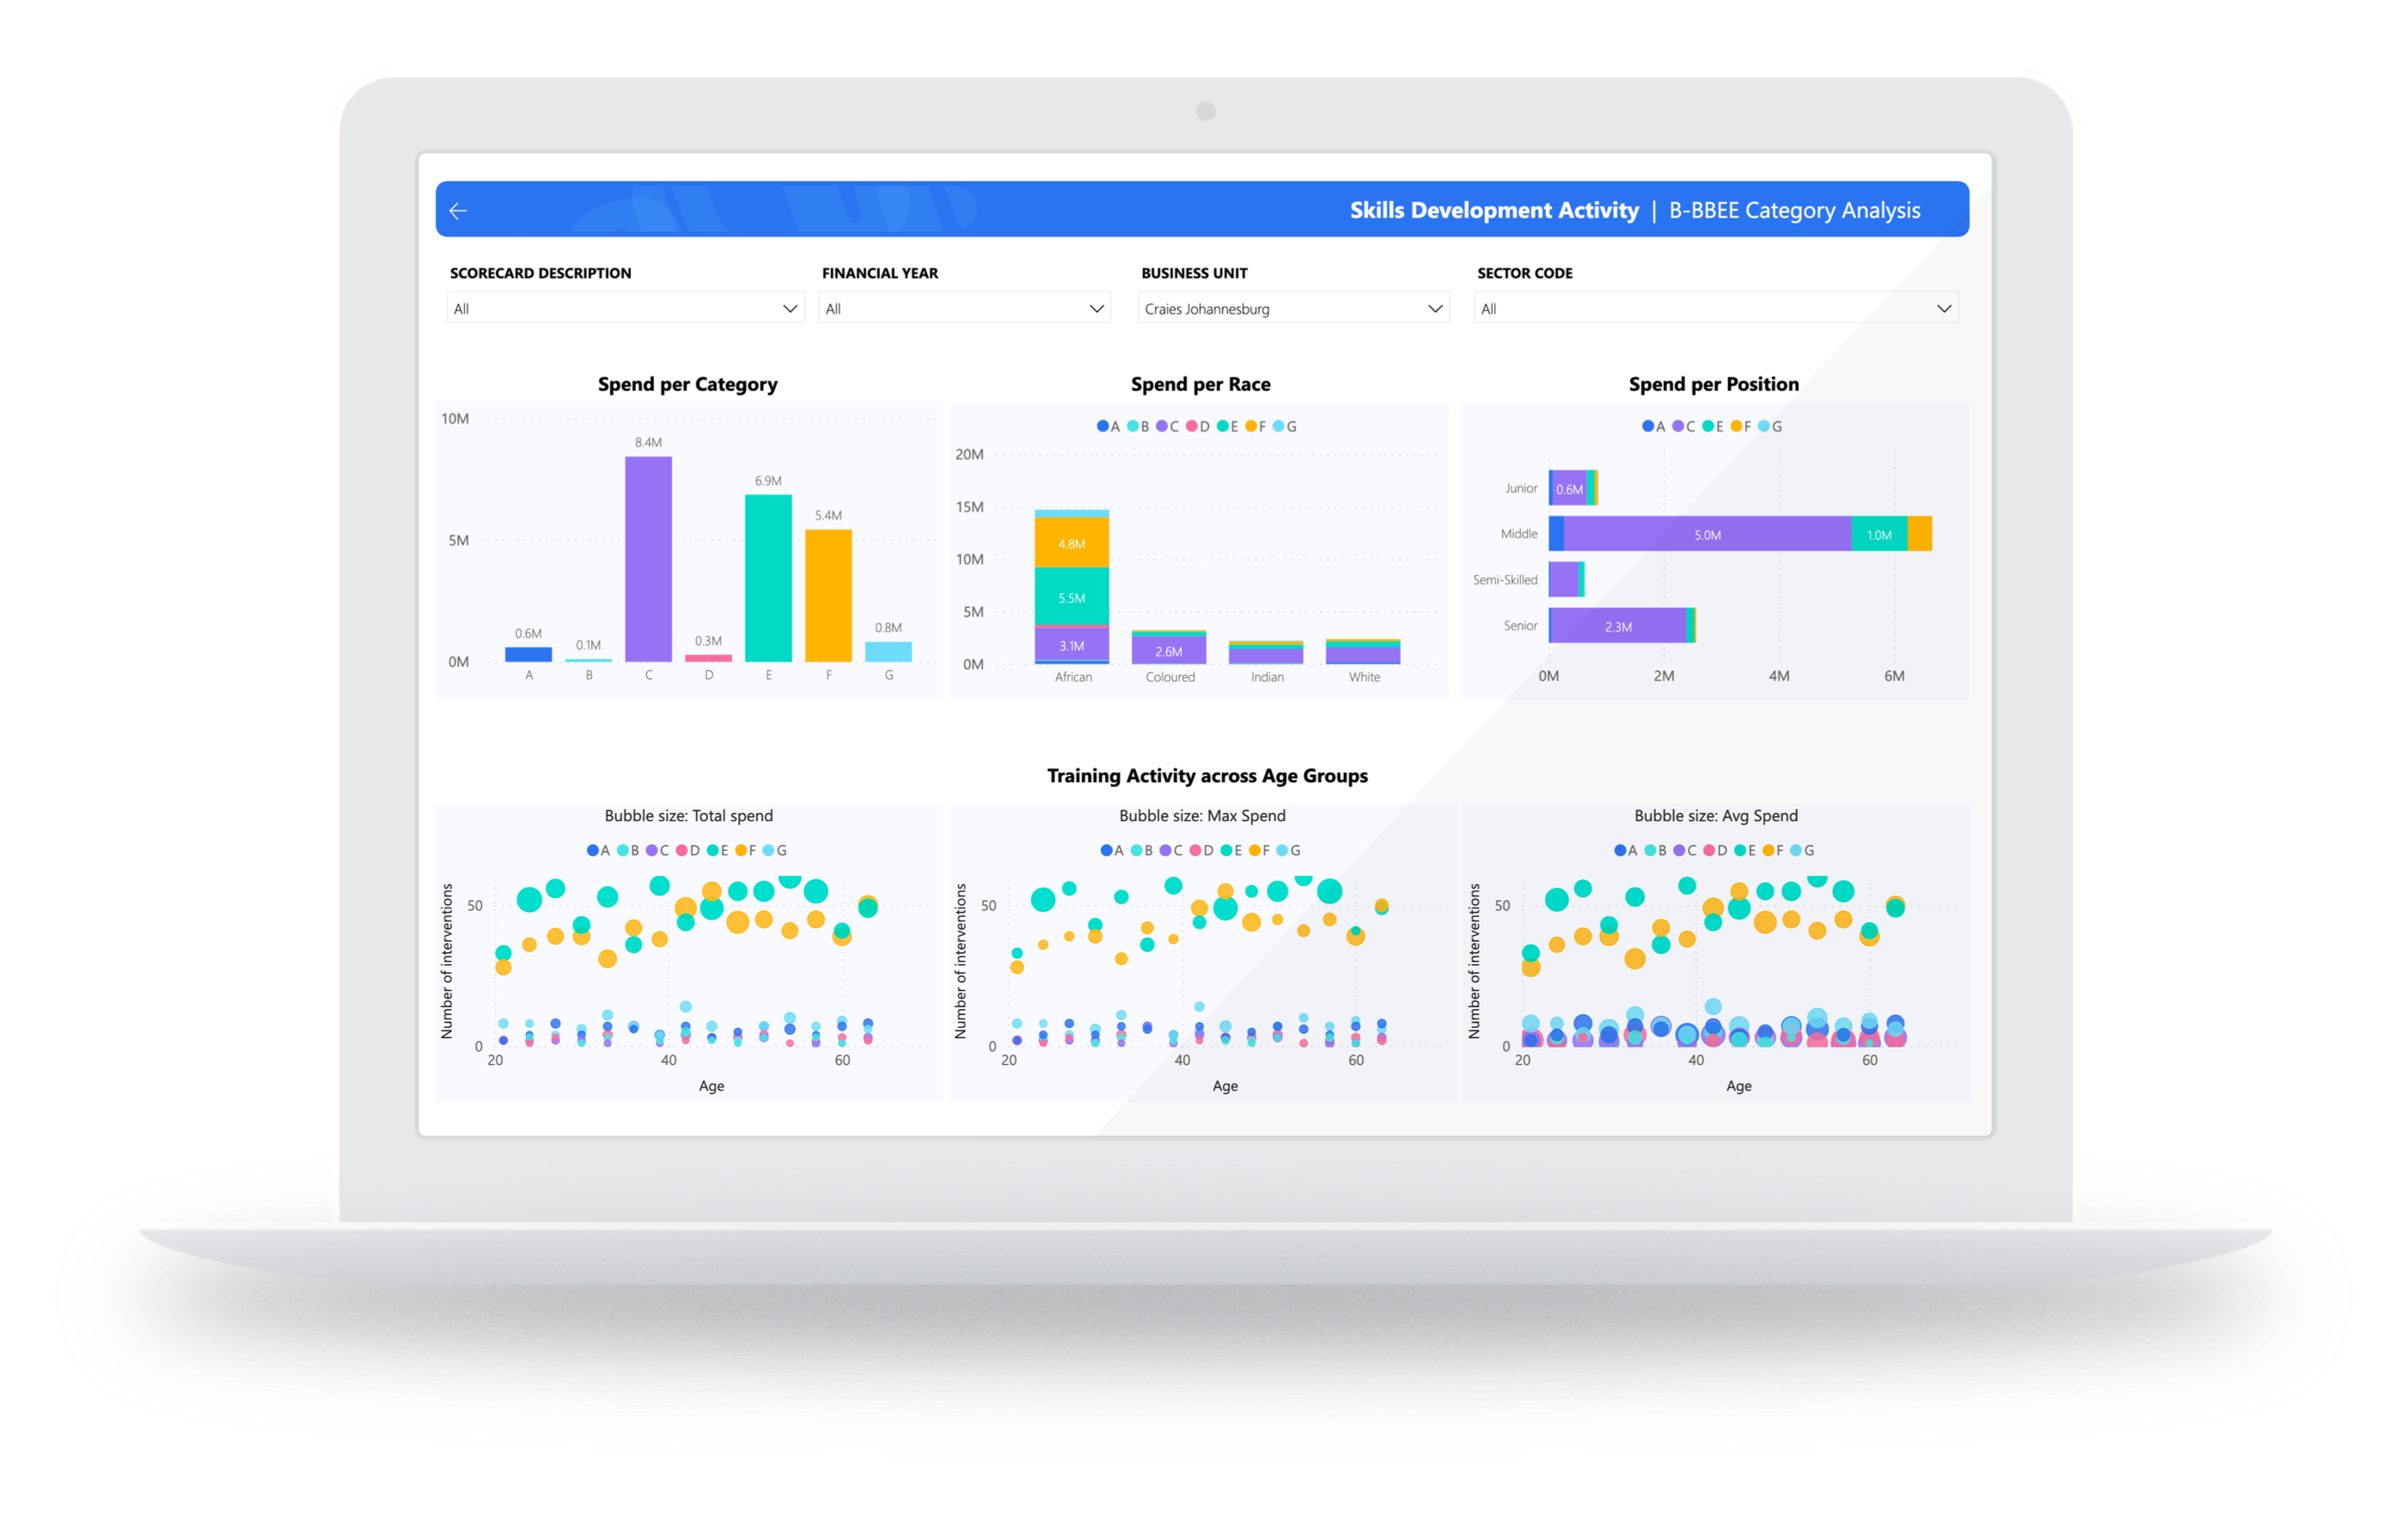
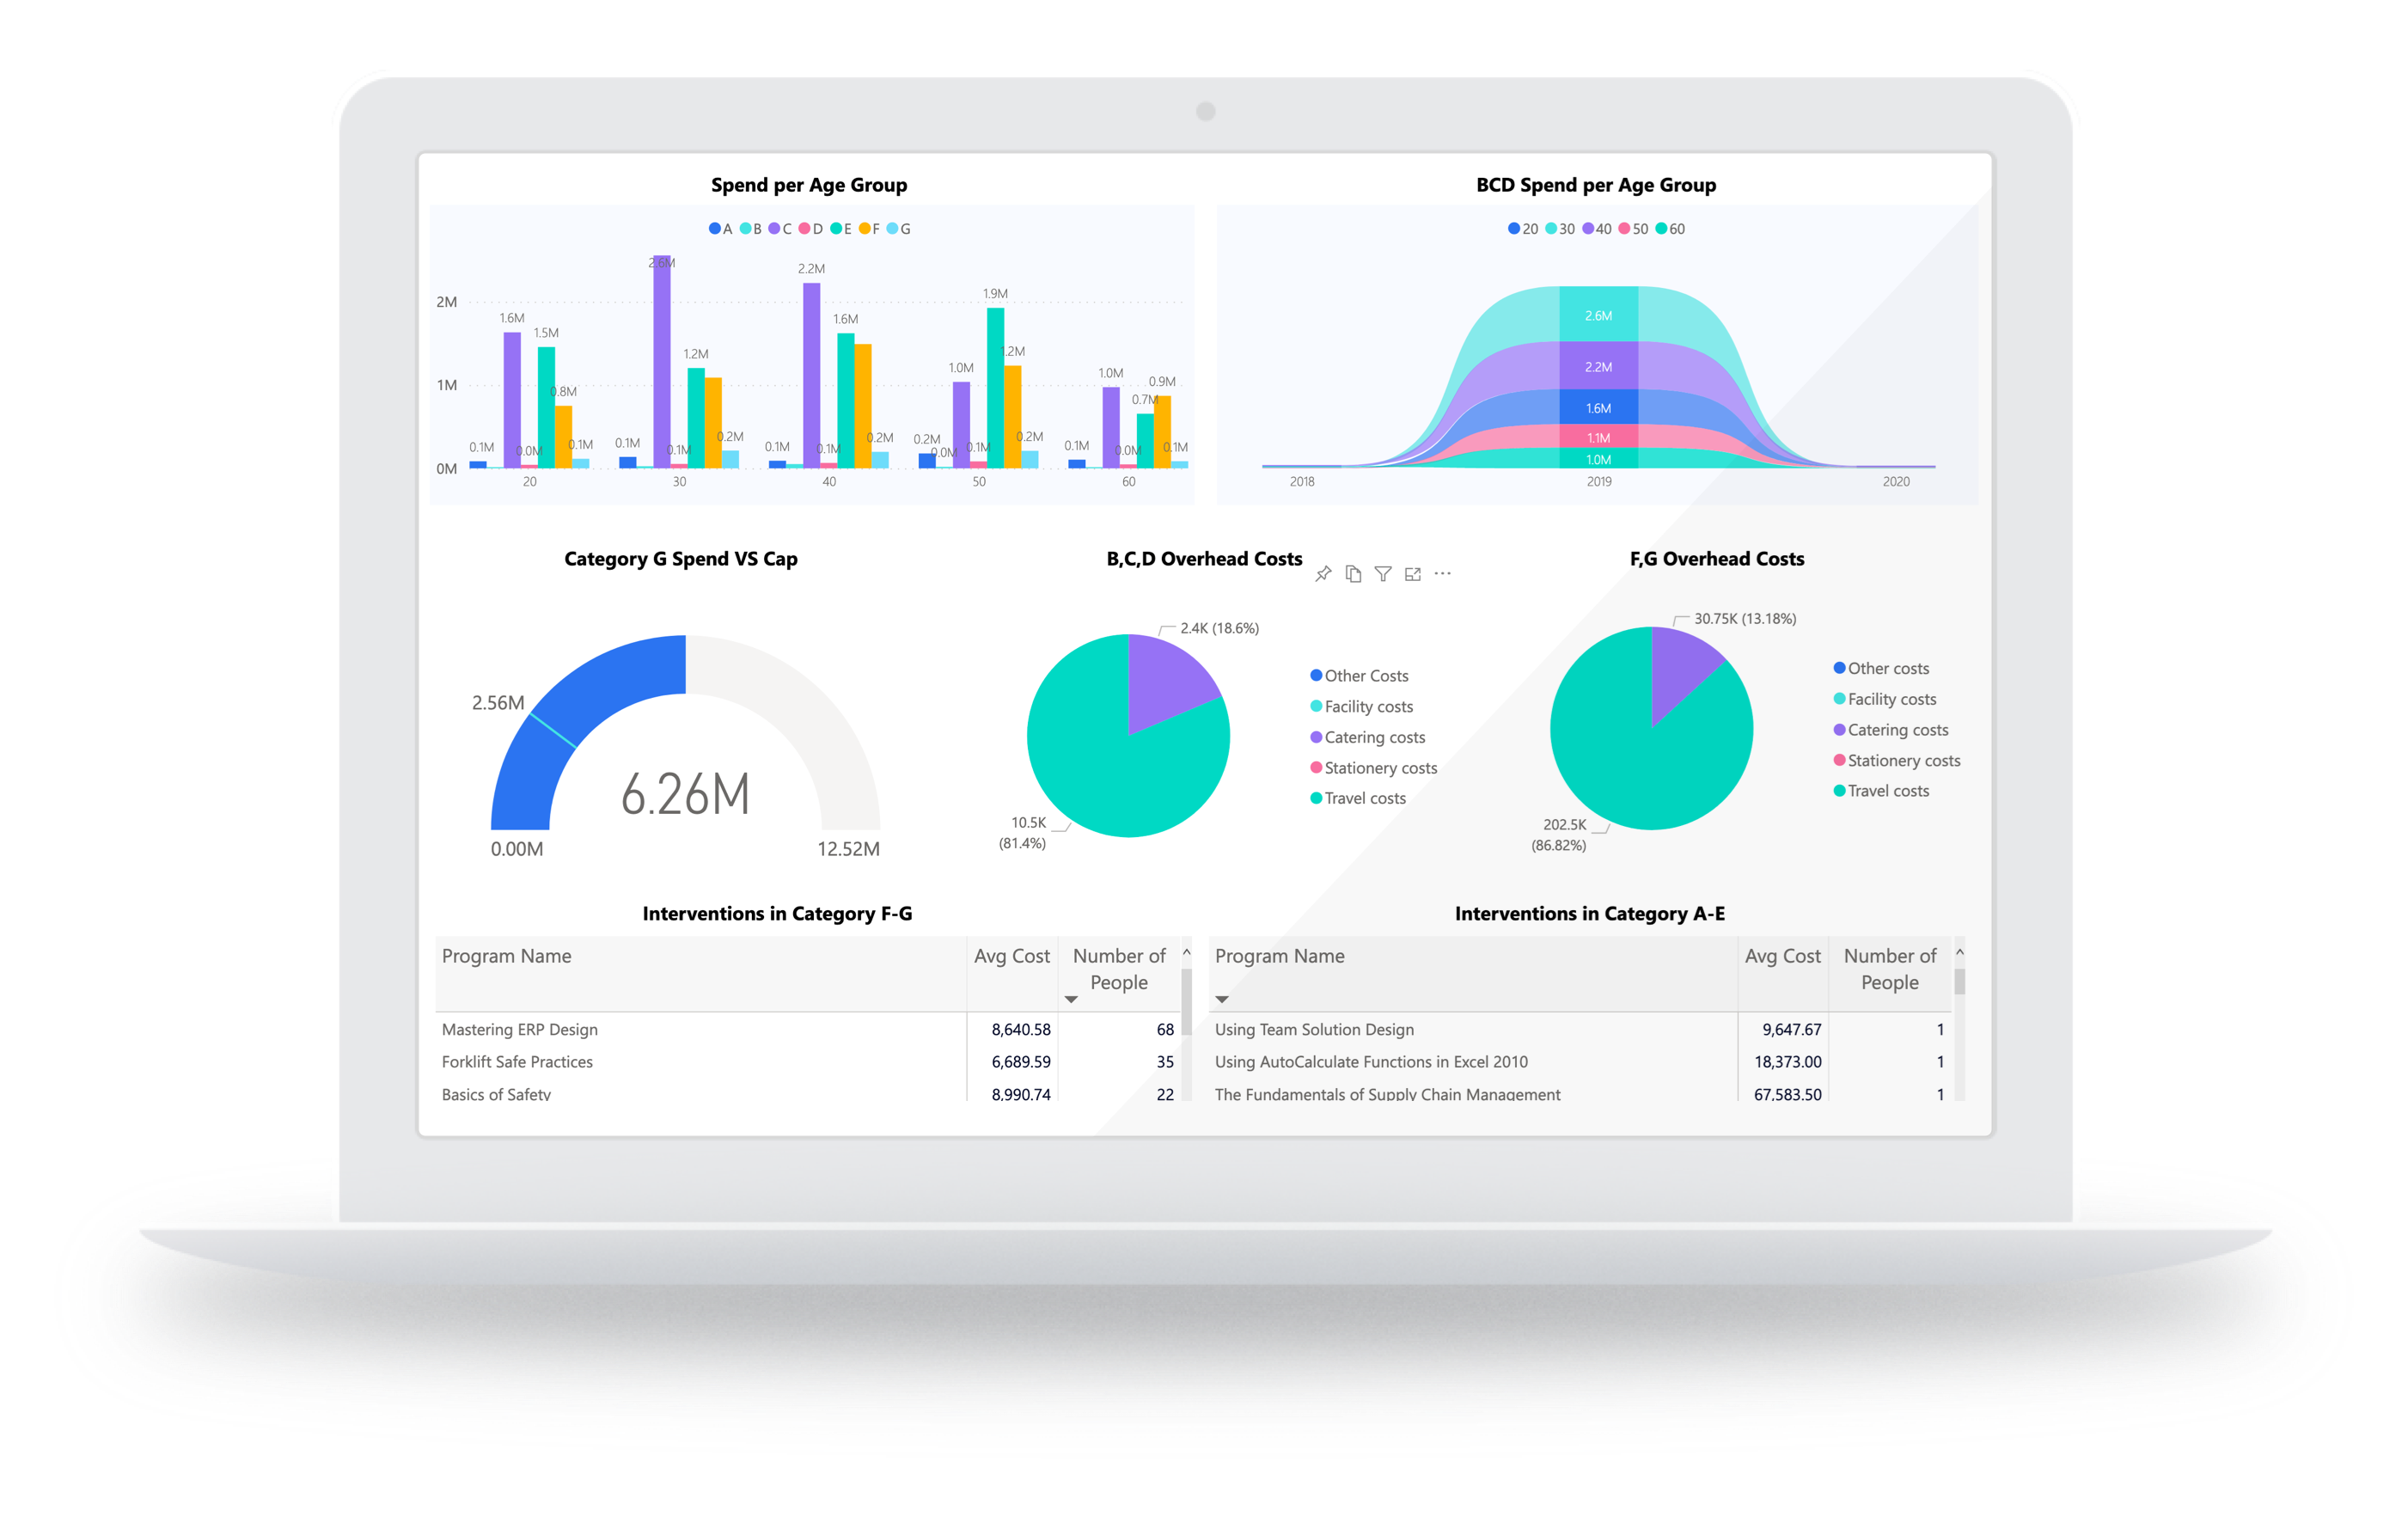
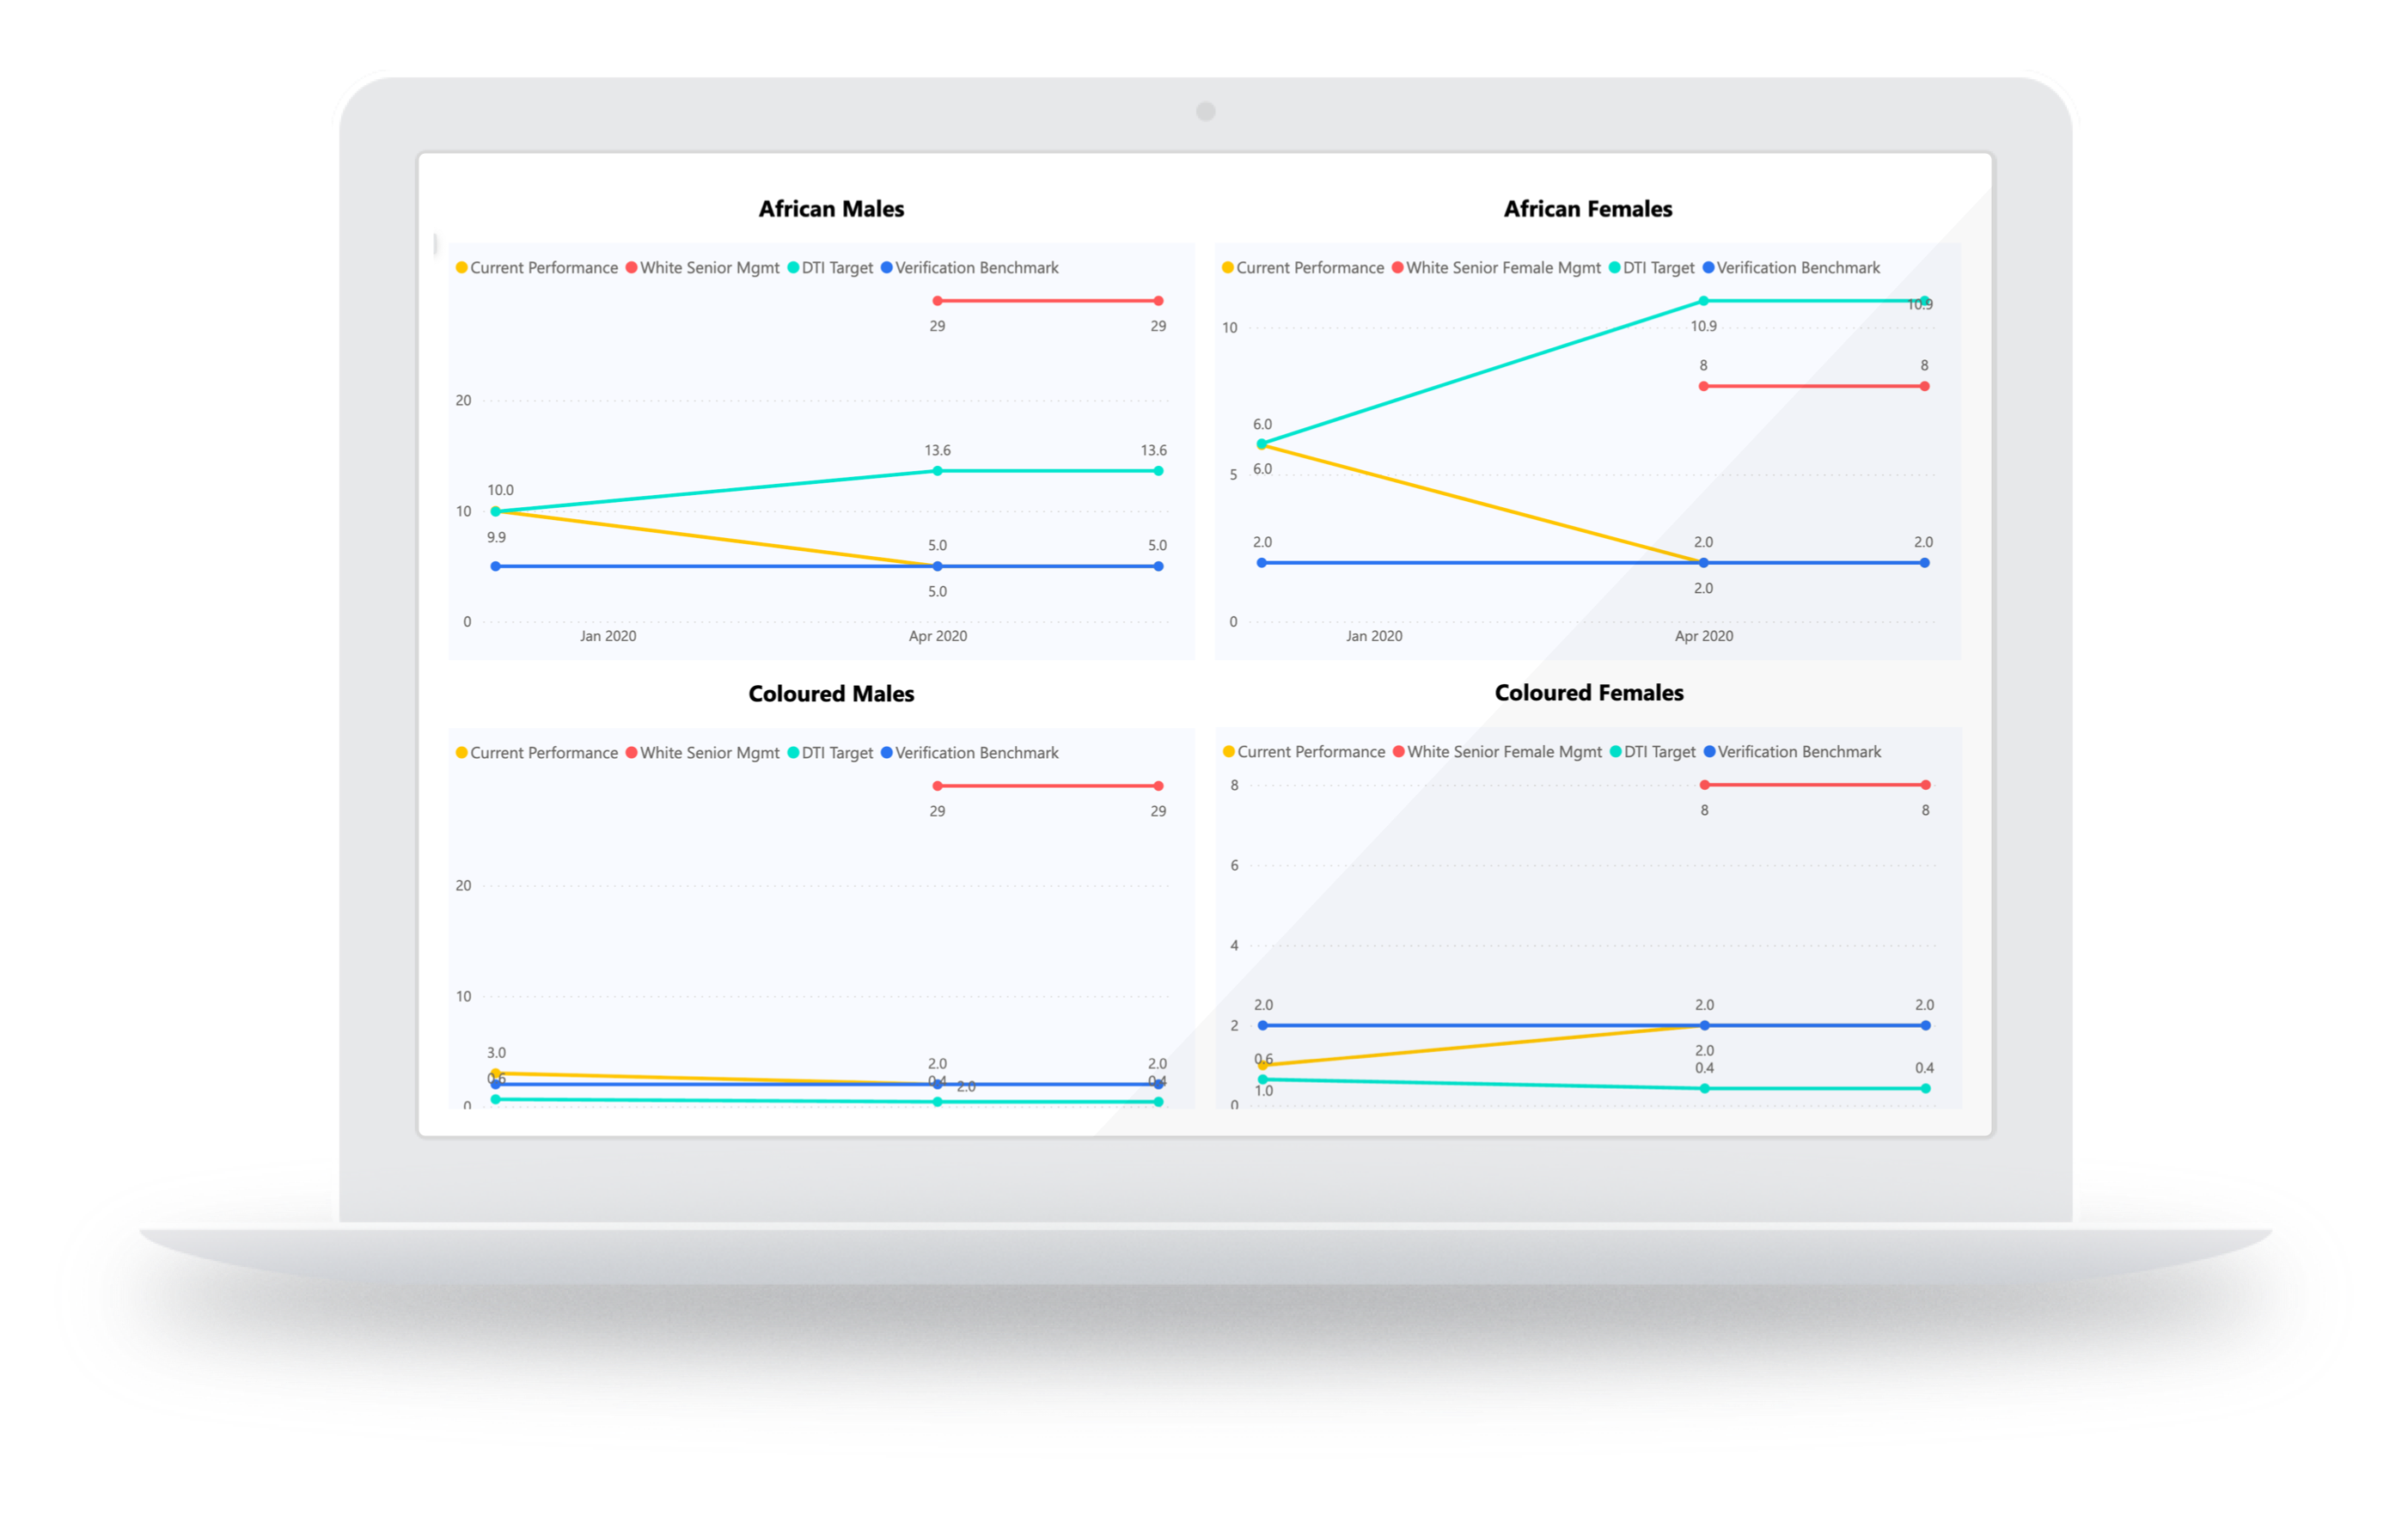
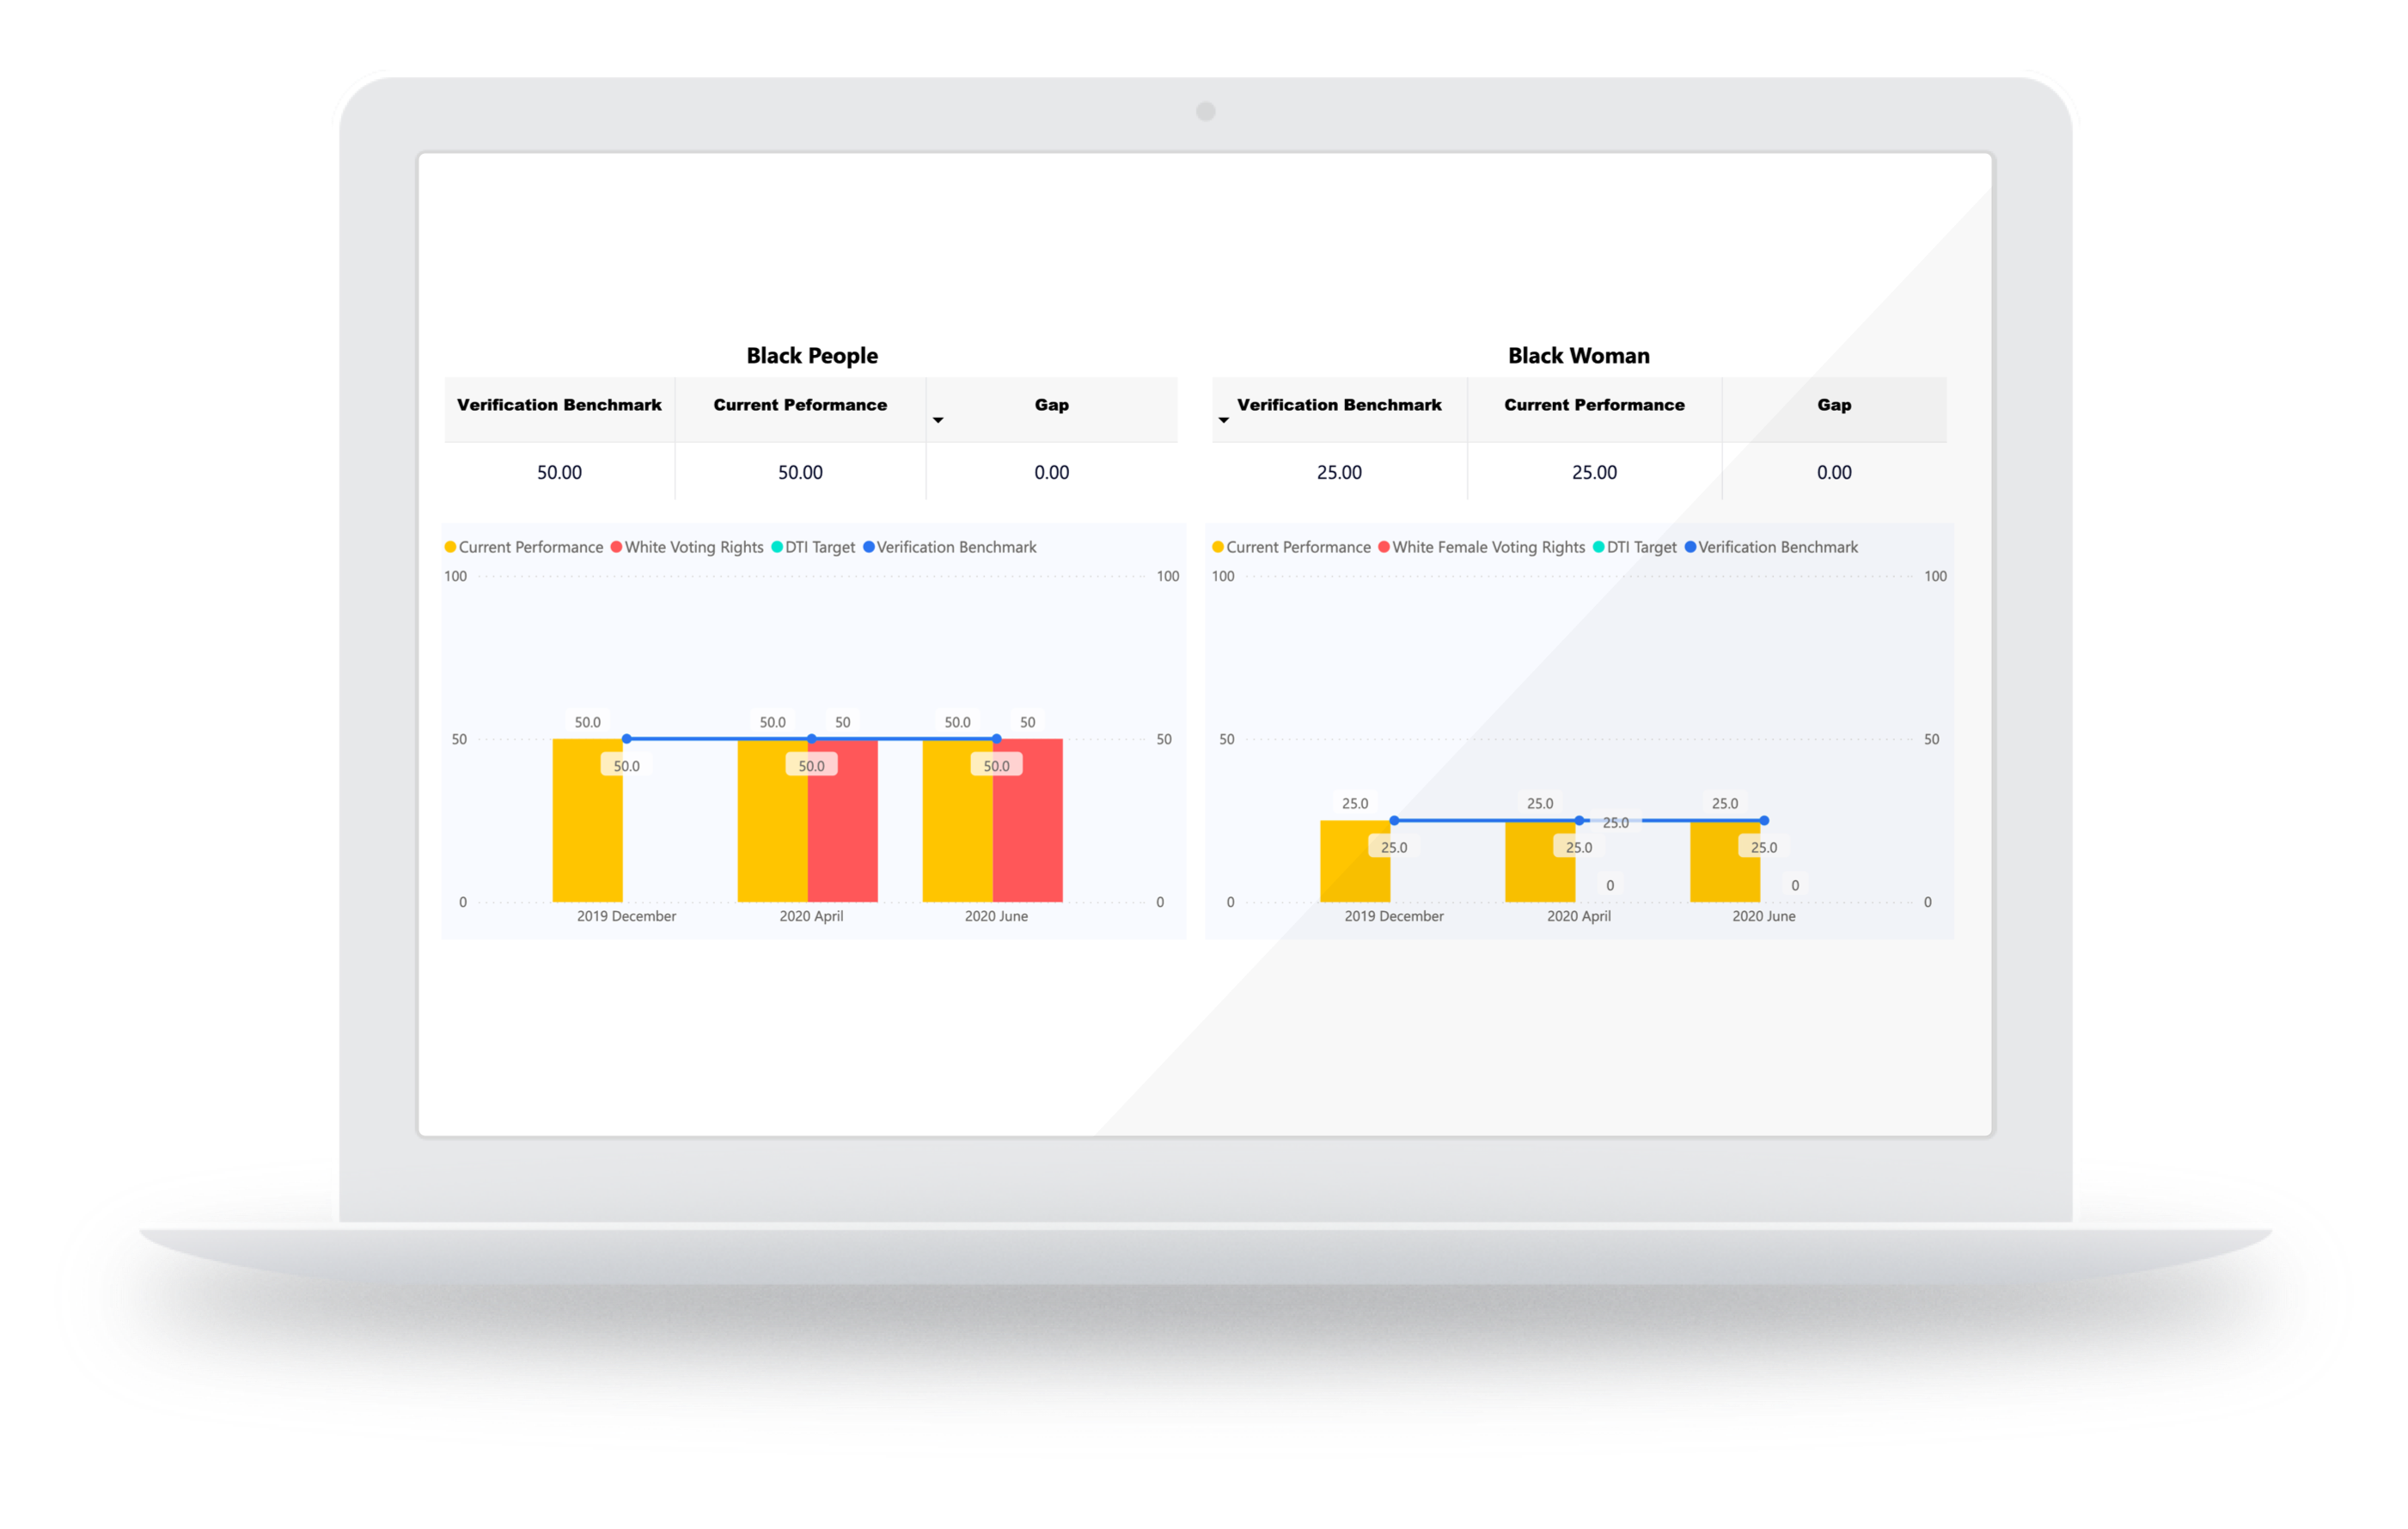
Travel through your data in real-time with interactive charts that update on-the-fly.

With Mpowered Analytics you can:

  • Combine the data of multiple business units, or isolate a specific one.
  • Slice your data by scorecard, period or sector code.
  • Lay multiple scorecards side-by-side to analyse trends over time.
  • Drill down on a specific metric to understand what underlying data contributed to it.
  • Export a chart to PDF, PowerPoint, Excel or an image file.

Works Beautifully with BEEtoolkit

BEEtoolkit and Mpowered Analytics were made for each other.

Together they:

  • Sync all your BEEtoolkit data and calculations automatically.
  • Enable you to create custom reports that suit your specific needs.
  • Enable comparison of pretty much anything you’ve uploaded in BEEtoolkit.
  • Unlock the years of data and scores and that you’ve accumulated in BEEtoolkit.
  • Eliminate the need for those complex exports and v-lookups that burden you the night before your board meeting.

Simplifies B-BBEE Commissioner Reporting

Mpowered Analytics comes pre-packaged with a dashboard that make it super simple to fill out the B-BBEE Commissioner’s report.

The Commissioner dashboard does all the heavy lifting of calculating the cohorts, locations and compositions of each B-BBEE pillar.

As long as all your data is loaded in BEEtoolkit your B-BBEE Commissioner Report will be a breeze.
 

Ready to take your reporting to the next level?